
A global leaderboard in the auto world never sits still. Car makers publish numbers on different bases, adjust strategies midyear, and shift capacity when supply chains twist, so anyone who wants a clean ranking has to slow down and define the ground rules before crunching the totals.
A baseline year helps. Clear metrics help even more. Once the math is laid out, the picture of who sits on top becomes far easier to follow.
The rankings below stick to full-year 2024 disclosures published by each major group. All shares use the 89.383 million worldwide industry volume cited in General Motors’ annual filing.
It offers a reproducible denominator, which is rare in an industry where terminology shifts between deliveries, wholesales, and shipments. Production adds another wrinkle since not every group publishes a unified figure, so the list highlights what is publicly stated and flags where only partial visibility exists.
We want to show scale, show where the numbers come from, then draw a straight line toward the forces that shaped the leaderboard. Let’s get started.
Key Takeaways
- Treat sales labels with caution. Deliveries, shipments, and wholesales measure different stages of the pipeline.
- Always check the denominator for market share. GM’s 89.383 million figure gives all OEMs the same measuring stick.
- Production is a separate axis that speaks to capacity, logistics, and supply chain resilience.
- One year does not define a trend. Some groups push volume. Some pull it back. Strategy shapes the number as much as demand.
What the Metrics Actually Measure
Metrics only make sense when the terms behind them stay clear.
Many analysts lean on regional vehicle databases to confirm production, registration shifts, and real-world fleet behavior, which is why tools like Ver Placa can help validate patterns that show up in public OEM filings
A quick breakdown helps set the stage before comparing any global rankings.
Sales Volume
Car makers rarely report sales in the same way. The most common labels fall into three buckets.
- Deliveries: retail and fleet units handed to customers.
- Wholesales: units sold into dealer networks or distributors.
- Shipments: units moved through consolidated operations.
A company can grow wholesale by building inventory or trim shipments even when retail demand holds steady.
Stellantis spelled that out in its own filing when it explained why shipments fell while inventory discipline took priority.
Market Share
Market share in this ranking is derived from a single formula.
OEM 2024 volume ÷ 89.383 million × 100.
It is directionally useful, not perfect, because each group defines “volume” in its own way.
Production Volume
Production varies even more. Some groups publish global output. Some split it across regions. Others offer only shipments or wholesale. Where a clean number exists, it appears in the ranking. Where not, the table notes the gap.
Background Forces That Shaped 2024 Volume

A few anchors explain why the leaderboard looks the way it does.
- Global market size: GM’s filing puts 2024 worldwide volume at 89.383 million vehicles.
- China’s gravitational pull: China moved about 31.4 million vehicles in 2024. Swings in that region can shift global rankings by entire percentage points.
- Capital pressure: Volkswagen is already setting public expectations for a multi-year investment cycle under tech transitions and tariff shocks, which influences how it frames both sales and production plans.
With those pressures in play, the ranking gains more context.
Biggest Car Makers Ranked By 2024 Sales Volume And Global Market Share
Volumes come from each group’s public 2024 disclosures. Market share uses the same denominator for all manufacturers.
What Drives Scale for Each Major Group
A quick look at each major group’s scale helps clarify why the leaderboard settles the way it does.
Every company reaches its totals through a mix of product strategy, regional strength, and manufacturing choices that shape year-to-year results.
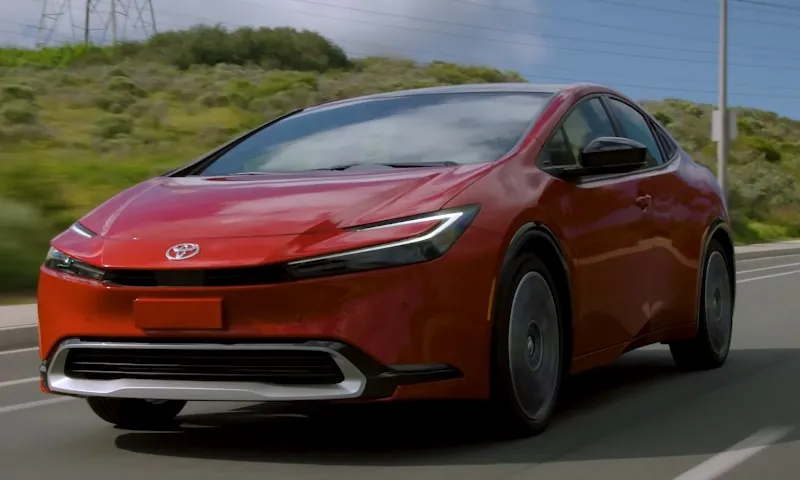
Toyota
Toyota’s reported 2024 volume lands near 10.8 million units. The company also built roughly 10.6 million vehicles across its global system that year.
When volume and production sit that close together, it signals smooth capacity use, strong supplier alignment, and a network that can push product into nearly every region.
What sets Toyota apart is a manufacturing style that prioritizes repeatability. Hybrids, internal combustion models, and commercial vehicles all run through a disciplined architecture that keeps volume predictable.
Practical angle: Toyota’s size is a reflection of its operating structure, not only consumer demand.
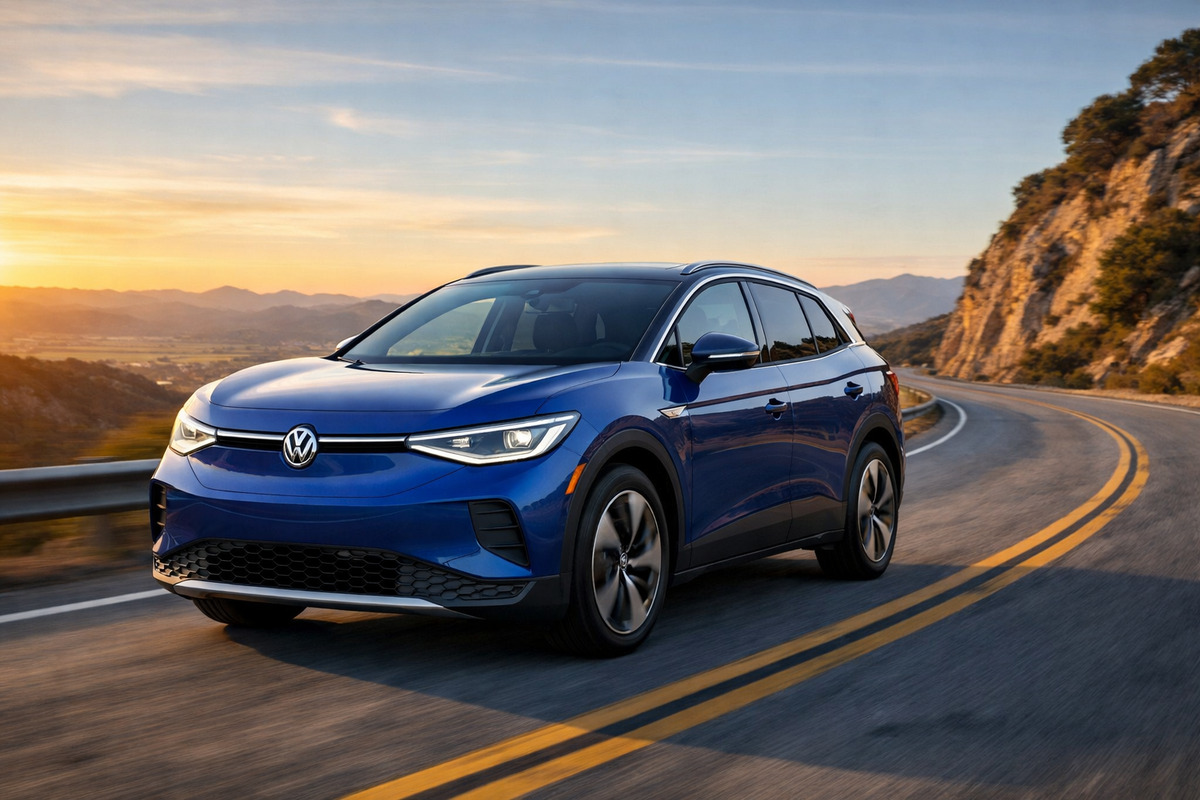
Volkswagen Group
Volkswagen published 9.0 million sales for 2024 and produced the same number, noting that its figure includes Chinese joint ventures.
The group also points to 115 production sites worldwide. That footprint forms a protective barrier during tightening conditions, since a wide plant base helps rebalance supply when regions move at different speeds.
The long investment phase that executives reference speaks to a simple math problem. Holding global scale requires constant reinvestment in platforms, software, and electrification, especially when Chinese pricing pressure climbs.
Hyundai Motor + Kia
View this post on Instagram
Hyundai reported 4.14 million in global sales in 2024, while Kia reached roughly 3.09 million. Together, they cleared about 7.23 million units. The combined figure positions the group solidly in the upper tier.
Hyundai and Kia gain stability from regional diversification. Korea, North America, Europe, India, and other fast-growing markets give the pair enough coverage to keep volume steady when one region softens.
Their model mix spans entry price points, electrified options, and performance badges without depending entirely on a single category.
General Motors
GM’s annual filing we mentioned earlier, offers rare clarity by publishing its global sales alongside the full industry volume.
GM sold 6.001 million vehicles worldwide in 2024. North America remains the financial pillar, while China still plays a meaningful role in the global ranking even as competitive pressure grows.
GM’s portfolio strategy leans heavily on trucks, SUVs, and commercial platforms. That creates a different profile from multi-brand groups such as Volkswagen and Hyundai, but the unit scale remains enough to hold a top-tier position.
Stellantis
Stellantis posted 5.4 million consolidated shipments in 2024. The group explained that the drop from the prior year came from deliberate inventory actions and lower sales performance. The key word there is deliberate.
Car makers occasionally trim shipments to protect margins, elevate pricing stability, or prevent bloated dealer stock.
Stellantis’ mix of brands across Europe, North America, and South America gives it a broad footprint. Still, when the group prioritizes inventory health over raw volume, the number will move down even if retail demand stays manageable.
SAIC Motor
SAIC disclosed roughly 4.639 million deliveries in 2024. The group sits very close to Ford and BYD on a global scale. Its volume reflects the sheer gravity of the Chinese market, especially since China moved around 31.4 million vehicles that year.
SAIC’s partnerships and joint ventures add further volume resilience. Exposure to home-market growth is large enough to influence global rankings, even if exports fluctuate year to year.
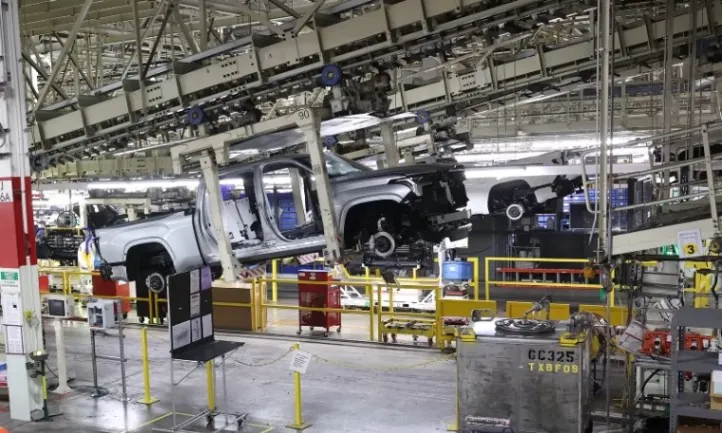
Ford Motor Company

Ford reported about 4.47 million wholesale vehicles worldwide. That number captures Ford’s global presence but also reflects an unusual business mix. Large trucks, commercial vehicles, and North American operations carry most of the company’s profitability.
Wholesale reporting can also shift year to year based on dealer stock choices. Still, Ford’s standing near the midpoint of the top ten is secure as long as its core truck lineup performs strongly.
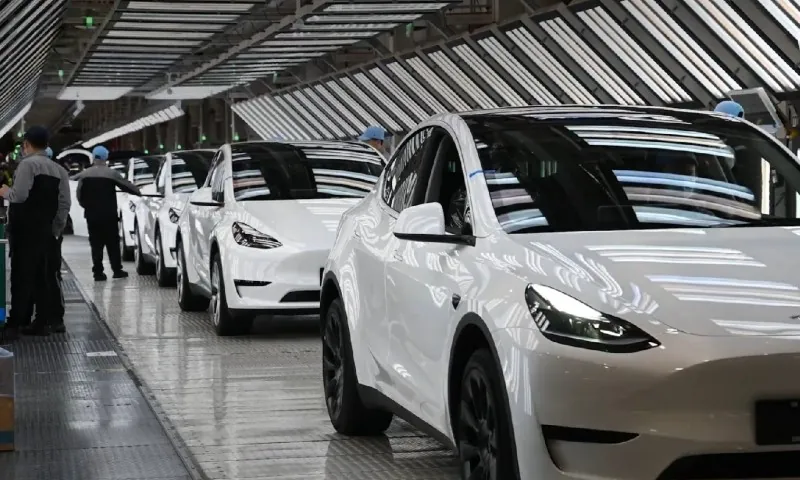
BYD
BYD disclosed 4.27 million annual sales for 2024. Growth is tightly connected to China’s enormous vehicle market and BYD’s rapidly expanding catalog of EVs and plug-in hybrids.
Scale alone is only part of the story. BYD’s manufacturing rhythm, battery vertical integration, and constant model iteration allow the company to maintain share in an environment where price cuts land almost weekly.
The ability to build fast and adjust quickly holds more weight than the raw number.
Nissan
Nissan reported 3.346 million global sales for FY2024. The company has been under strategic pressure for several years, and the broader environment for Japanese manufacturers is pushing executives toward more collaboration and shared investment in software and electrification.
Volume gaps become more visible when competitors grow faster in China or expand EV product lines more aggressively. Even so, Nissan’s global presence still places it securely inside the top ten.
Geely Holding Group
Geely reported 3.337 million units for 2024. The group’s portfolio stretches across multiple brands, including partnerships and acquisitions that broaden both geographic reach and model depth.
Industry watchers often underestimate Geely’s scale because of how its brands are presented individually. When aggregated, the group’s footprint places it shoulder to shoulder with Nissan in global share terms.
Renault Group
Renault published 2.265 million worldwide group sales in 2024. The company is smaller in global unit scale than its Japanese, Chinese, and American rivals, but it maintains a strong position in Europe. Hybrid and EV mix targets shape much of Renault’s medium-range strategy.
Size in the auto industry does not always reflect influence. Renault remains a major regional player with a tight product plan and a clear electrification roadmap.
Biggest Car Makers Ranked By Production
Production rankings only include figures that automakers publish clearly and consistently.
| Rank | Group | 2024 Production |
| 1 | Toyota | ~10.6M vehicles produced |
| 2 | Volkswagen Group (incl. China JVs) | 9.0M vehicles produced |
Other groups do not publish unified production totals in a comparable format. Stellantis releases shipments. Ford releases wholesale.
Many Chinese groups split production across subsidiaries. For a strict manufacturer ranking, use a standardized dataset that aggregates production on the same basis, then compare it with each group’s report.
Patterns That Explain Why the Ranking Looks the Way It Does

Market behavior leaves fingerprints on every global ranking, and a few consistent forces shape how the biggest automakers end up in their positions each year.
1. Regional Exposure Decides Who Absorbs Shocks
China moves more than thirty million vehicles per year. Any group with heavy exposure there can rise or fall in global rankings simply because demand shifts by a few percent. A small dip in that region equals a massive hit to worldwide totals.
2. Multi-Brand Coverage Protects Volume
Large portfolios across price points, body styles, and regional markets help groups like Volkswagen and Hyundai-Kia defend scale without relying on one segment. They can shift emphasis across brands or regions without rebuilding the strategy from scratch.
3. Inventory Discipline Changes the Numbers
A company can pull down shipments for financial reasons. Stellantis gave a textbook example of that. Lower shipments do not always mean weak demand. Sometimes they signal discipline.
4. Production Footprint Becomes a Strategic Asset
Volkswagen’s plant count matters. Toyota’s ability to run more than ten million units through its system matters. Production is an anchor when supply chains swing. Groups with strong manufacturing presence often hold top positions year after year.
What to Watch in the Next Cycle
- Investment pressure in Europe and China: Volkswagen’s upcoming capital plan will determine how much output stays in Europe and how much shifts to more cost-efficient regions.
- Japanese strategic realignment: Collaboration among Japanese OEMs is gaining traction since electrification and software investment require massive pooled resources.
China’s export momentum: BYD and other Chinese groups can grow rapidly on unit volume, but sustained profitability in export markets is the real stress test.